Weather Modeling and Analysis
Below are examples of the current models available to run weather regressions on your utility data.
LINEAR MODEL
Simple linear model.
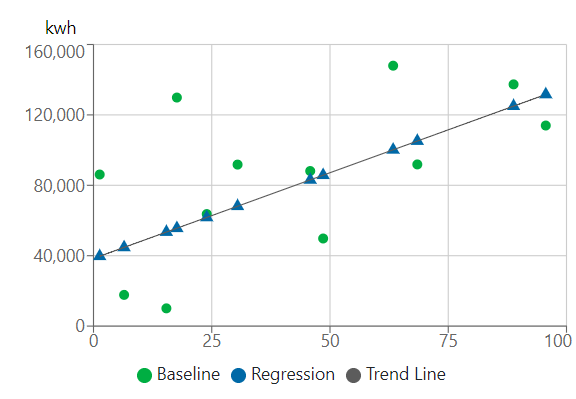
Regression Equation:
I+x0∗R
3PC MODEL
3-parameter cooling model. Used for when energy usage is dependent on cooling in warm weather and mostly constant the rest of the year.
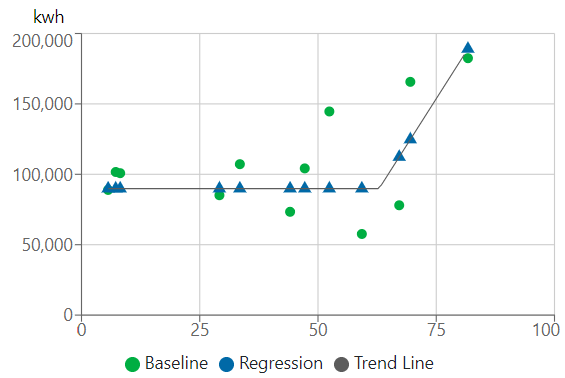
Regression Equation:
I+x0∗(R−x1)+
3PH MODEL
3-parameter heating model. Used for when energy usage is dependent on heating in cold weather and mostly constant the rest of the year.
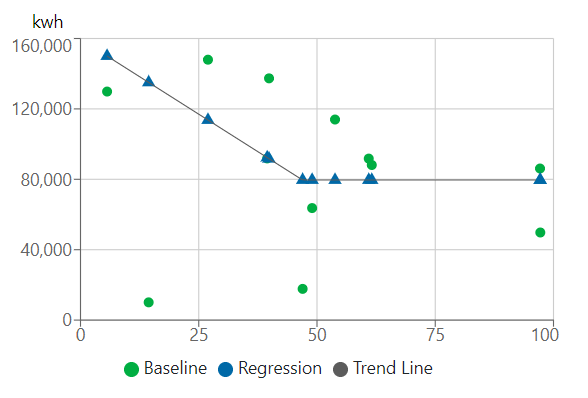
Regression Equation:
I+x0∗(x1−R)+
5P MODEL
5-parameter cooling model. Used for when energy usage is dependent on both heating and cooling.
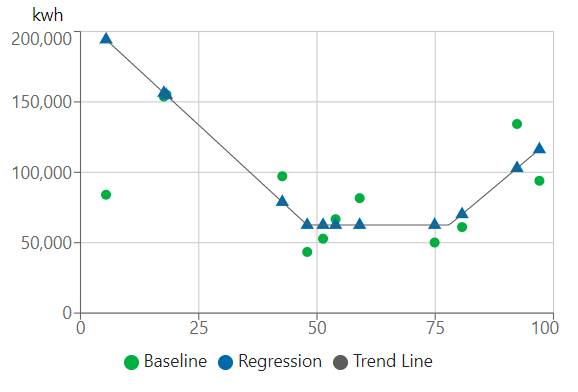
Regression Equation:
I+x0∗(R−x1)++x2∗(x3−R)+
Regressions Events
Regression events are an IPMVP recommended method to account for unplanned or non-recurring fluctuations in energy usage that falls outside the scope of a performance contract. These events can be anything from unplanned occupancy changes, renovations/remodels, or natural disasters.
EnergyTracer accounts for these events in performance analysis by taking a factor or constant value adjusting the monthly usage by this factor. These factors should be used sparingly and with confidence that the factor accurately reflects the change in energy usage. These factors should not be used to correct routine energy fluctuations (like winter or summer holidays), instead a production regressor should be tried first.
Regression Events belong to an 'event collection' and this whole collection is applied to a regression model. It is recommended to have one collection per regression but this is not required. If you are confident the collection is applicable to multiple regressions, it may be used this way.
Creating collections is done on the analysis tab under the 'Regression Events' section. First give the collection a name (name does not affect anything it is just an identifier). Then add the scale and constant factors that are applicable (this can be both for the baseline and performance period). Scale factors are applied first then constant factor (example: y=mx+b). Once the collection is created it can be added to a new regression model in the model setting are by the date range select.
After the collection is added to a regression in can be edited anytime, expect for data in that regression's baseline period. If data is edited within the baseline period for any regressions using this collection, a warning will be displayed and the regression will be removed from any projects it is a part of.
Admin
Comments